S&P 500 Time Horizon Analysis
I'm a big saver. Having taken the CFA and become my own personal retirement savings money-manager, it is pivotal for me to make sure my return assumptions are reasonable for my retirement portfolio.
Recently I asked myself, "What is the effect of time horizon on your equity returns?" To analyze this, let's look at return multiplers and annualized returns for the S&P on the first day of any year since 1960. I calculated these metrics across 5, 10, 15, 20, 25, 30 and 35 years. The results are in the following chart.
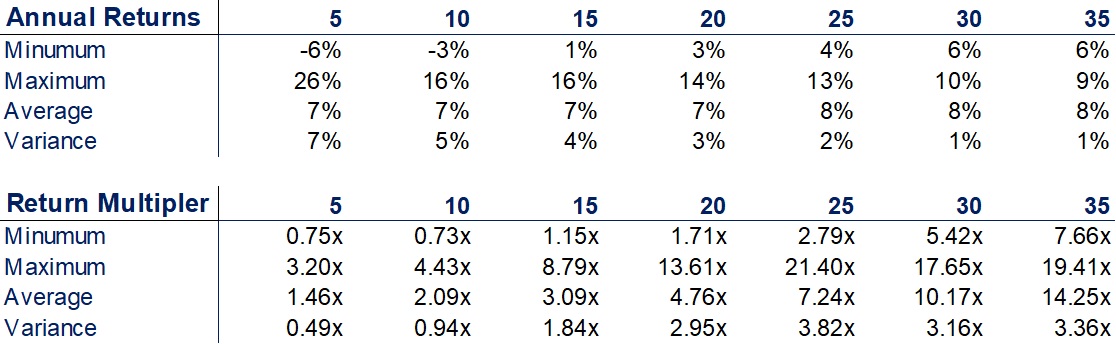
For every sample of yearly returns, our average return is consistently between 7%-8%. However, these results are fascinating because as our time horizon increases (aka as you move left to right across the chart), our variance of returns shrinks from 7% to 1%. The range of 5 years returns is between -6% and 26%; however, our range of returns for 35 years is only 6%-9%!
Our maximum possible return for the S&P for this data falls into the 25 year time horizon, where we could have gotten $21.40 dollars for every $1 investing in the S&P. This would have been if we entered the market in January 1975, right after the oil crisis, and exited in January 2000, right before the stock market crash.
So, what is our takeaways here?
Long time horizons are pivotal for retirement investing. If you get great returns over a few years from your initial investment, lucky you. However, if you're investment drops in value, ensure you have a "fortress balance sheet" (to quote Jamie Dimon) and aren't required to liquidate your investment in a shorter time horizon. If you hold the course, your investment will almost inevitably result in an annualized return between 6%-10%.
Second, once your nest egg has grown to it's required size and you are within 5-10 years of retirement, ensure you have properly allocated between stocks and bonds to withstand any volatility in the market.
If you are interested in looking at additional time frames, you can download my excel analysis here, which includes a time horizon simulator.
One complaint many of you might have from this analysis, is "that's great, Brendan, but I will be dollar-cost averaging my money over the next 25 years, instead of having a single entry point. What will those returns look like?" Well, may I say, that is a great question! Lucky for you, I will be releasing another blog shortly with the same analysis done by dollar-cost averaging.
Thanks for reading!