Modeling Keurig Machine Savings
Financial modeling is great in professional setting or for trading, but it can also be an excellent tool in personal finance.
This recently came up when I was debating buying a Keurig coffee machine. During these pandemic times, I now drink most of my coffee at home. I knew it would be cost effective in the near term, but what about the long-term? To answer that question, we'll need to use some financial modeling!
TL;DR
If you're one of the super busy types and want to get straight to the point, buying a Keurig machine will save you between $72 and $82 per month, which comes to almost TEN THOUSAND DOLLARS over ten years. The super cool workbook can be found here.
We will use scenario analysis to model this. First we will designate a set of logic to get from cups drank --> cost savings. We will then create a set of scenarios, each with their own set of parameters. Finally, we will designate a probability distribution for the occurance of each scenario, which will allow us to create an expected value for our savings.
The Yearly Schedule sheet contains the logic to calculate cost savings from our relevant set of parameters. This require setting cups per day and cost per cup for:
- Costs without Keurig Machine: Drinking coffee bought at Dunkin' Donuts and work.
- Costs with Keurig Machine: Drinking coffee with Keurig and at work.
The easy model parameters are the cost structures. We can easily lookup the cost of a Dunkin' cup of coffee. From looking on my app, my standard order of a medium iced coffee with a hazelnut shot runs $3.09. For Keurig we'll need to include the cost of the machine ($104.99, amortized over it's lifespan aka 10 years), as well as the cost of the pods. This left us with the following setup for our logic.
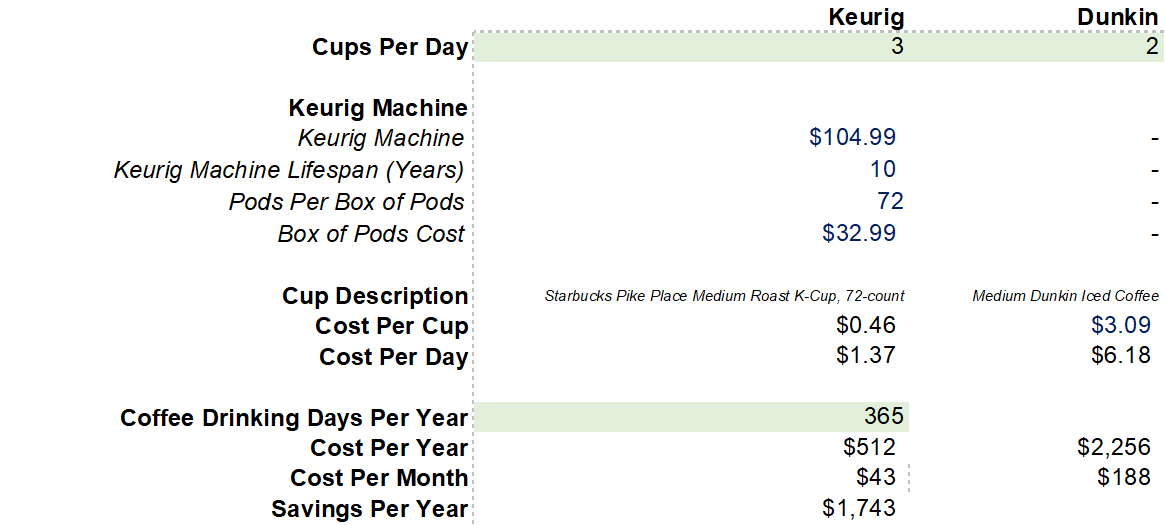
Green-highlighted cells correspond to dynamic parameters i.e. parameters we will adjust according to the relevant scenario. Cells with blue font are hard-coded with the values we just discussed. The cost per cup for Keurig is based on the cells above, while the cost per cup for Dunkin' is static.
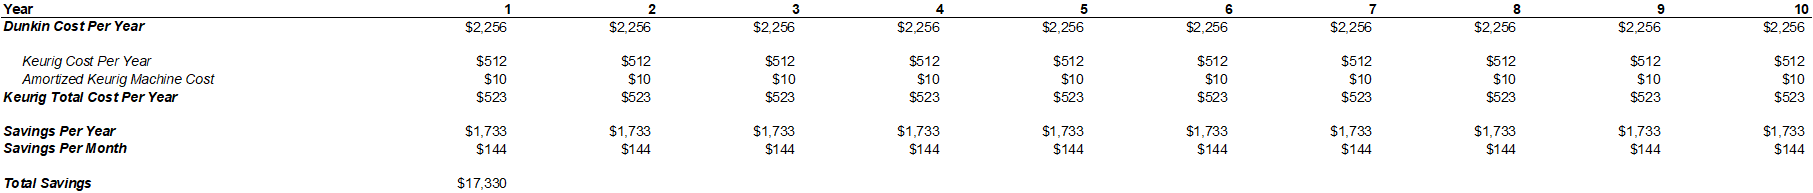
Using this logic, we can create a 10 year schedule, including the amortization of the Keurig machine, which can also be found in the Yearly Schedule sheet.
Our next step will be to design the actual scenarios. Since, as in the days of yonder, once we go back to work I won't be drinking as much coffee at home, we'll need to design assumptions for how many days we'll use the Keurig. The Keurig pods produce a 8 oz cup, while Dunkin's medium is 24 oz. I usually drink 2 Keurig cups in place of 1 Dunkin' cup, so the cost per day is dynamic based on cost per cup * cups per day.
Now that we have our model setup, we'll designate our scenarios, which can be found in the Scenario Params sheet.
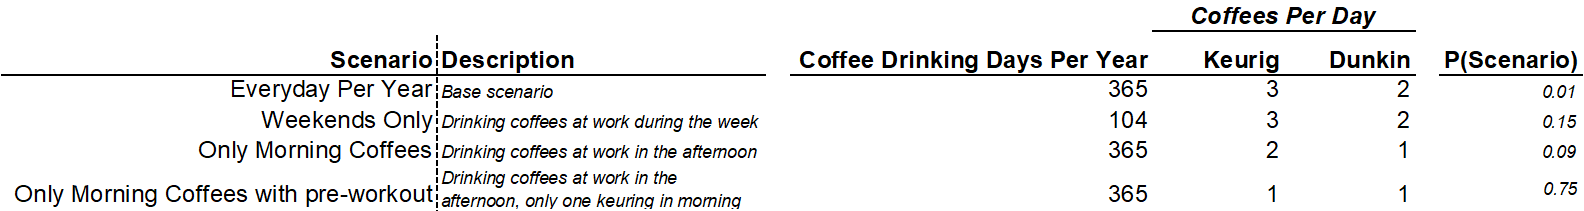
Ignoring the Description and P(Scenario) columns, we can see that I've added three data columns, one for each of the green cells in the Yearly Schedule sheet. These will change the relevant model inputs using the dropdown found in cell C3.
Our last set is to put each of these scenarios through our model using a data table. We can find this output in the Scenario Outcomes sheet.
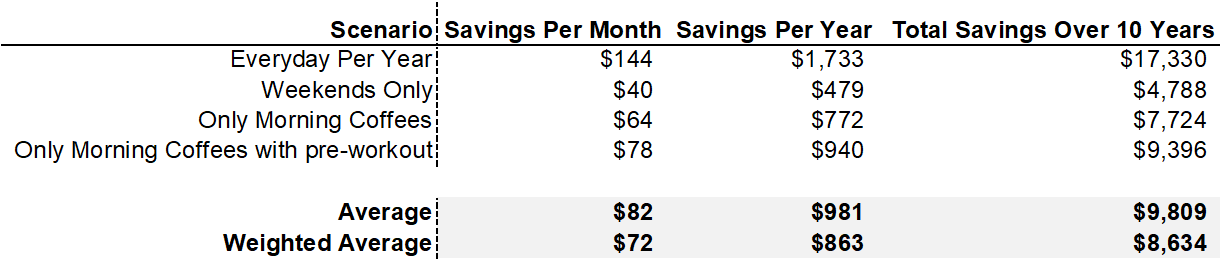
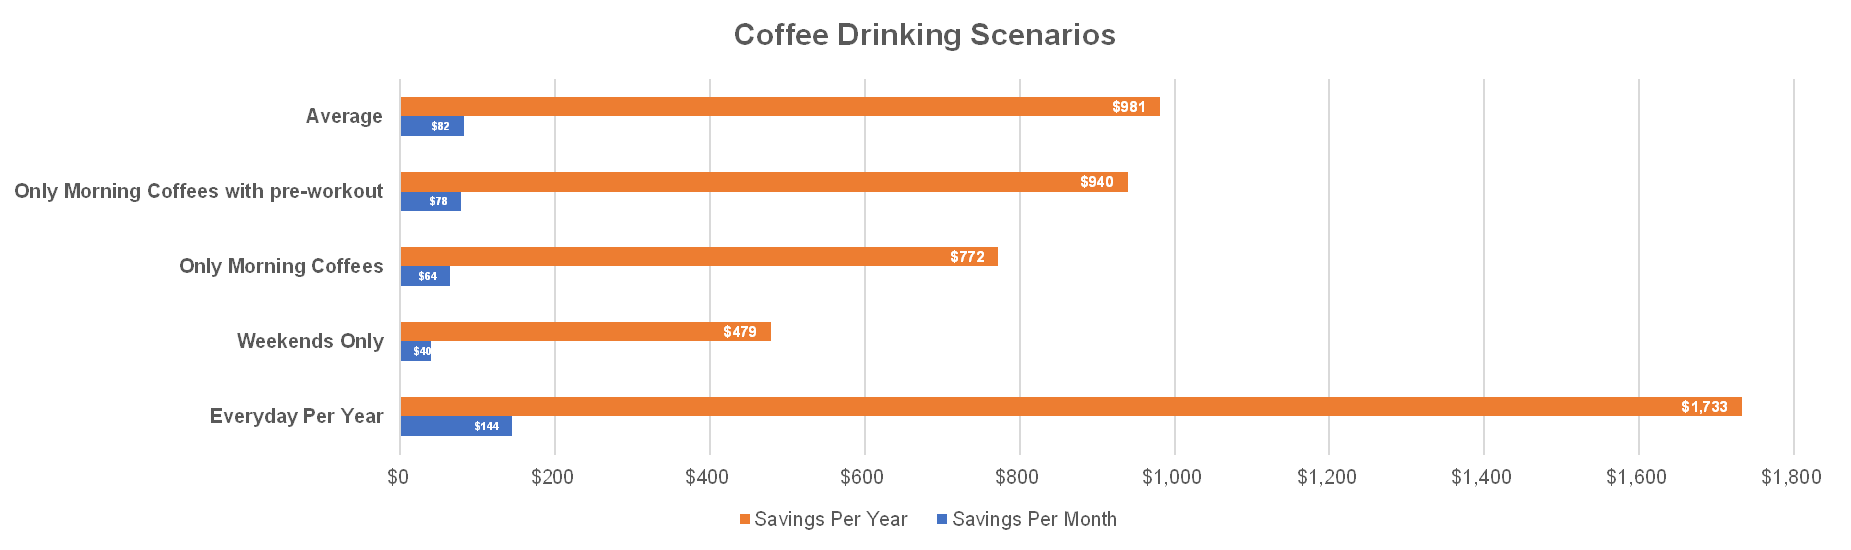
In our worst case scenario, Weekends Only, we'll save $40 a month, which will eventually become $479 a year. In our best case scenario, Everday Per Year, we'll save $144 a month, which will eventually become $1,733 A YEAR! An equal-weighted average comes out to $82 a month, while our probability-weighted average has an expected value of $72 a month. Any way we slice it, buying a Keurig is a great idea!
The full workbook can be found here.